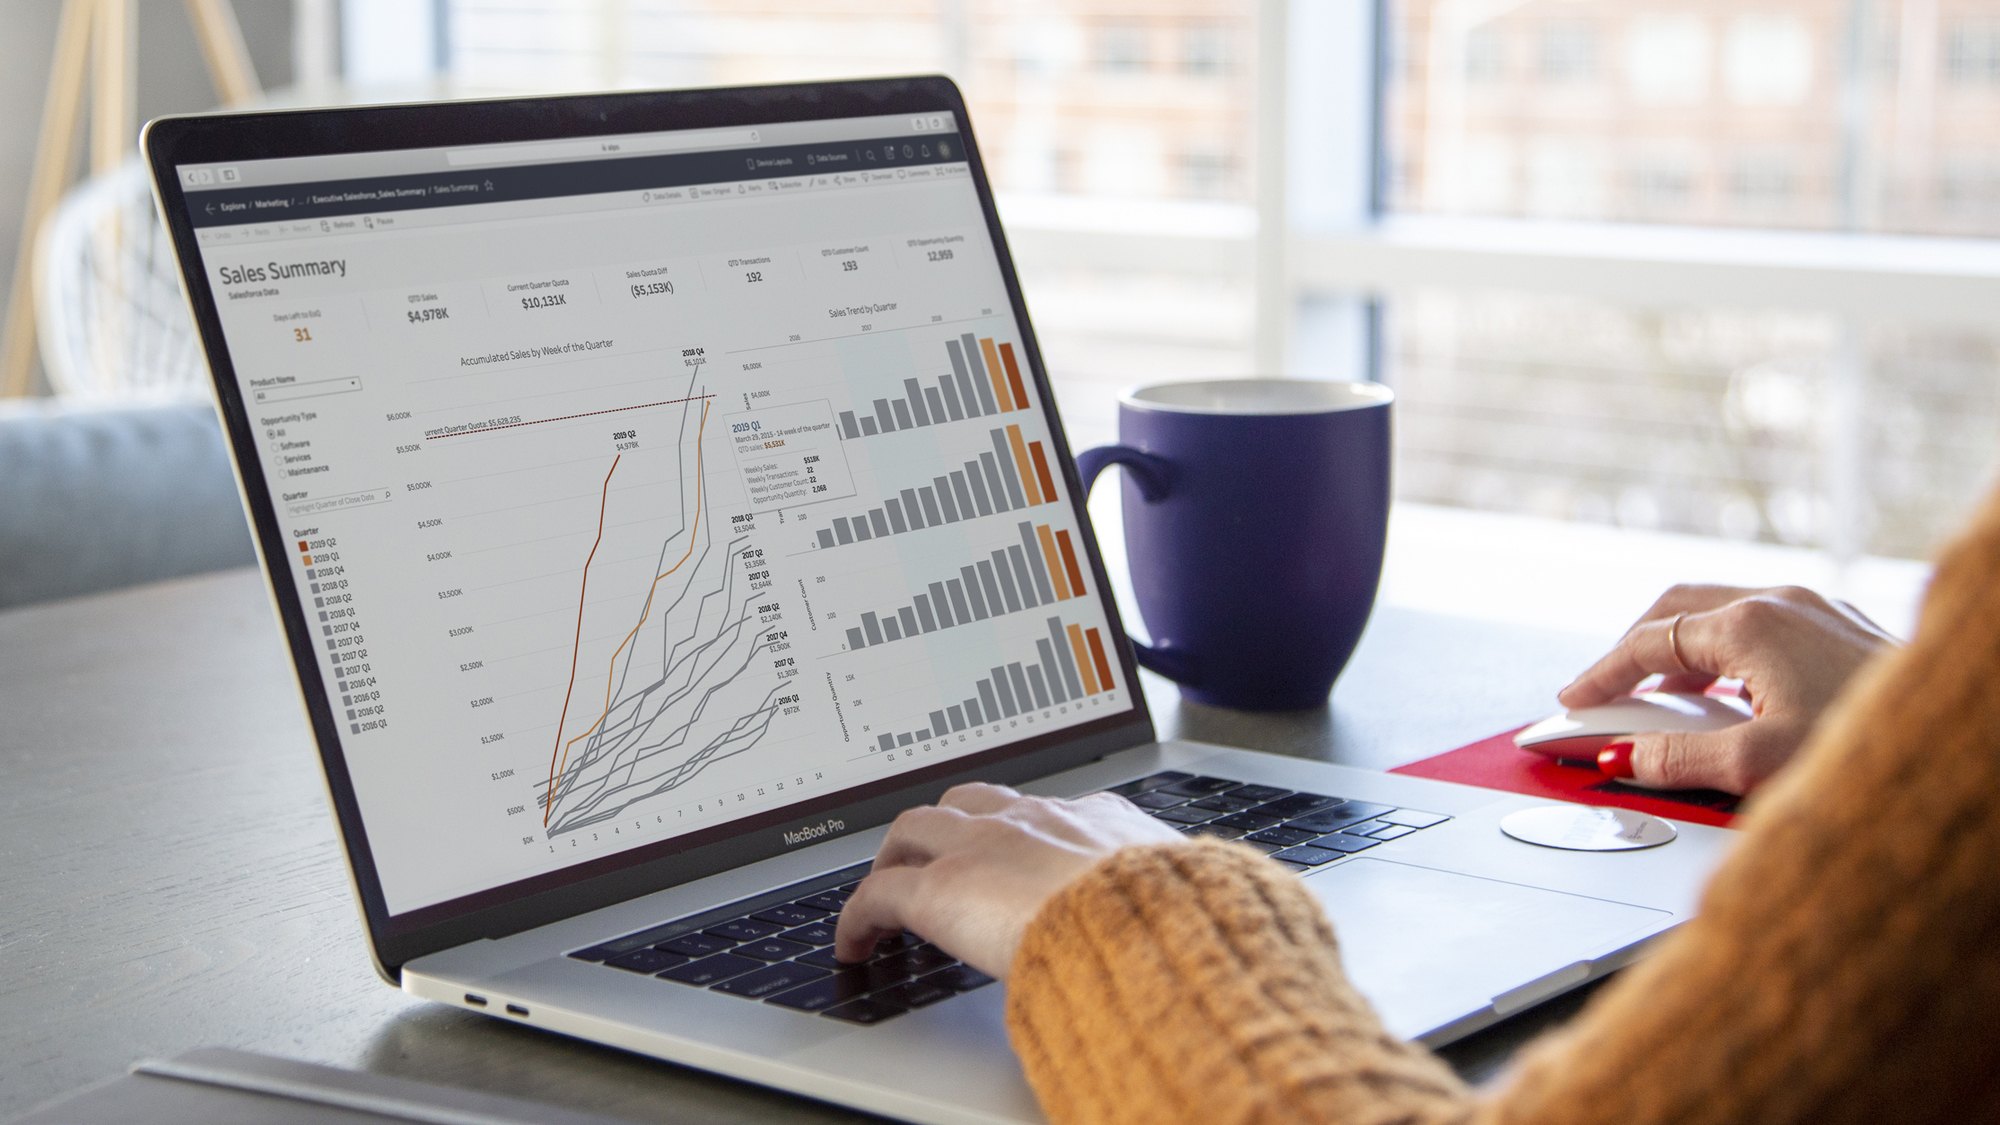
Module 1: Introduction to Data Science and Tableau
- 1.1 What is Data Science?
- Overview of Data Science and its applications
- The Role of a Data Scientist
- Difference between Data Science, Data Analytics, and Machine Learning
- 1.2 Introduction to Tableau
- Overview of Tableau and its features
- Tableau Desktop vs Tableau Online vs Tableau Server
- Why Tableau for Data Science?
- Tableau Interface and Navigation (Workspace, Shelves, Data Pane)
- Setting Up Tableau and Connecting to Data
Module 2: Getting Started with Data in Tableau
- 2.1 Connecting to Data Sources
- Connecting to various data sources (Excel, SQL, CSV, Web Data, etc.)
- Live vs Extract Data Connections
- Data Source Pane Overview
- Understanding Data Connections and Data Blending
- 2.2 Data Preparation in Tableau
- Exploring Data in Tableau (Data View, Metadata, Data Types)
- Data Cleaning and Transformation in Tableau
- Renaming Fields, Handling Null Values, and Filtering Data
- Using Tableau Prep for Data Cleaning and Transformation
- Combining Data from Multiple Sources with Data Blending
Module 3: Data Visualization in Tableau
- 3.1 Introduction to Tableau Visualizations
- Overview of Visualizations: Charts, Graphs, and Tables
- Principles of Effective Data Visualization
- Choosing the Right Visualization for Your Data (Bar, Line, Pie, etc.)
- 3.2 Basic Visualizations
- Creating and Customizing Bar Charts, Line Charts, and Pie Charts
- Building Histograms, Scatter Plots, and Box Plots
- Formatting Visualizations: Titles, Labels, Colors, and Legends
- Using Filters and Sorting Data
- 3.3 Advanced Visualizations
- Creating Heatmaps and Tree Maps
- Building Geospatial Visualizations (Maps)
- Bullet Graphs, Gantt Charts, and Waterfall Charts
- Dual-Axis and Combined Charts (e.g., Line + Bar)
- Customizing Tooltips for Enhanced Interactivity
- 3.4 Interactive Dashboards
- Combining Multiple Visuals into a Single Dashboard
- Using Filters, Slicers, and Parameters to Control Dashboards
- Creating Actions: Filter, Highlight, and URL Actions
- Adding Interactivity with Dynamic Dashboards and Navigation
Module 4: Data Analysis in Tableau
- 4.1 Descriptive Analytics in Tableau
- Basic Statistical Analysis (Mean, Median, Mode, Standard Deviation)
- Summarizing Data with Aggregations and Calculations
- Using Tableau’s Built-in Analytics Pane for Trend Lines, Forecasting
- Time Series Analysis: Year-over-Year, Moving Averages
- 4.2 Advanced Calculations in Tableau
- Creating Calculated Fields and Parameters
- Working with Logical Functions (IF, CASE, IIF)
- String and Date Functions for Data Transformation
- Window Functions for Running Totals and Moving Averages
- Table Calculations: Percent of Total, Rank, and Moving Window Calculations
- 4.3 Statistical Analysis in Tableau
- Using Tableau for Correlation and Regression Analysis
- Trend Lines and Forecasting with Tableau’s Built-in Models
- ANOVA, t-tests, and other Hypothesis Testing with Tableau
- Predictive Analytics with Tableau (using Tableau’s Forecasting Features)
Module 5: Working with Time Data in Tableau
- 5.1 Time Series Analysis
- Working with Dates and Date Parts in Tableau
- Time Aggregation and Calculating Time-Based Metrics
- Trend Analysis and Seasonal Decomposition
- 5.2 Creating Date-Based Calculations
- Calculating Year-to-Date, Quarter-to-Date, and Month-to-Date
- Running Totals and Moving Averages Over Time
- Date Difference and Date Parts Calculations
- 5.3 Advanced Time Series Forecasting
- Using Tableau’s Automatic Forecasting Models
- Customizing Forecasts with Exponential Smoothing
- Understanding Forecasting Accuracy and Error Metrics
Module 6: Data Science with Tableau and R/Python Integration
- 6.1 Introduction to Tableau’s Integration with R and Python
- Overview of External Scripts in Tableau (R, Python)
- Installing R/Python Integration in Tableau
- Using Tableau with R and Python for Advanced Analytics
- 6.2 Using R Scripts in Tableau
- Setting Up R Integration
- Running R Scripts for Predictive Modeling in Tableau
- Advanced Statistical Analysis and Machine Learning Models in R
- 6.3 Using Python Scripts in Tableau
- Setting Up Python Integration (TabPy)
- Using Python Libraries (e.g., Pandas, Scikit-learn) for Data Science in Tableau
- Building Predictive Models and Visualizing Results in Tableau
- 6.4 Machine Learning with Tableau
- Building and Deploying Simple Machine Learning Models in Tableau
- Model Evaluation and Predictions within Tableau Dashboards
- Using Regression and Classification Models in Tableau
Module 7: Tableau Advanced Features for Data Science
- 7.1 Data Blending and Joins
- Understanding Data Blending vs. Data Joins in Tableau
- Creating Complex Joins Between Multiple Data Sources
- Using Data Blending for Aggregated Insights from Multiple Sources
- 7.2 Creating Advanced Calculations
- Level of Detail (LOD) Expressions: FIXED, INCLUDE, and EXCLUDE
- Context Filters and Filter Contexts in Calculations
- Complex Calculations for Business Metrics (e.g., Customer Lifetime Value)
- 7.3 Tableau’s Advanced Analytics Features
- Tableau’s Analytics Pane: Reference Lines, Trend Lines, Forecasts, and Statistical Summaries
- Creating and Using Forecasting Models in Tableau
- Customizing and Visualizing Data Distribution (Box Plots, Violin Plots)
Module 8: Building Interactive Dashboards in Tableau
- 8.1 Dashboard Design Principles
- Design Principles for Effective Dashboards
- User Experience (UX) Considerations in Dashboard Design
- Designing Dashboards for Storytelling
- 8.2 Creating Interactive Dashboards
- Using Filters, Actions, and Parameters in Dashboards
- Creating Dynamic Dashboards that Respond to User Selections
- Using Hierarchies and Drill-Down Features for Exploration
- 8.3 Mobile Dashboard Design
- Creating Dashboards Optimized for Mobile Devices
- Customizing Layouts for Different Screen Sizes
- Best Practices for Mobile Interactivity
Module 9: Tableau Reporting and Sharing
- 9.1 Publishing Reports and Dashboards
- Publishing Workbooks to Tableau Server or Tableau Online
- Sharing Dashboards with Stakeholders
- Using Tableau Public for Sharing Public Visualizations
- 9.2 Collaboration and Sharing Insights
- Creating and Sharing Tableau Stories for Insight Communication
- Scheduling Data Refreshes in Tableau Server/Online
- Collaboration through Comments and Annotations
- 9.3 Tableau Server and Tableau Online Overview
- Tableau Server vs Tableau Online: Features and Differences
- Managing Users and Permissions in Tableau Server/Online
- Automating Report Distribution in Tableau Server


